
Artificial Intelligence

,
,
How do you measure the effectiveness of your gen AI? What if we say there are AI metrics and specific KPIs for AI agents that'll help track accuracy, operational success metrics, efficiency, user engagement, and financial impact, ensuring that your investments deliver tangible AI agent ROI analysis that can measure cost savings and revenue growth?
Key performance indicators (KPIs) are essential for tracking progress and aligning initiatives like AI performance metrics with other business objectives. AI technology is crucial in evolving these metrics and KPIs to match its dynamic applications. When adopting GenAI, KPIs are critical in assessing model performance, using market trends, enabling data-driven insights for AI implementation adjustments, and demonstrating value. However, many organizations rely solely on computation-based KPIs used for traditional AI, overlooking crucial metrics like system performance, adoption, and business value—often mistaking operational efficiency gains for actual end goals.
In this post, we'll dive deeper into the KPIs essential for measuring the effectiveness of gen AI, including all the specific metrics and how to use them to make the most of your investments.
Model quality metrics are key to assessing the accuracy and effectiveness of AI outputs. Evaluating a model's performance involves visualizing its effectiveness through various metrics, such as confusion matrices and qualitative evaluations. Computation-based metrics, like assessing a product search model against AI's ability to work well for bounded outputs. Precision measures relevance, recall captures completeness, and the F1 score provides a balanced average between the two.
Generative AI's capacity to produce diverse outputs—from original to potentially harmful content—necessitates a subjective evaluation approach. Model-based metrics utilize auto-raters, which are large language models designed for assessment using machine learning, to evaluate performance based on criteria such as creativity, accuracy, and relevance. These judge models can automatically analyze responses using an evaluation template to measure output quality effectively.
There are two standard methods to produce quantitative metrics about a model's performance:
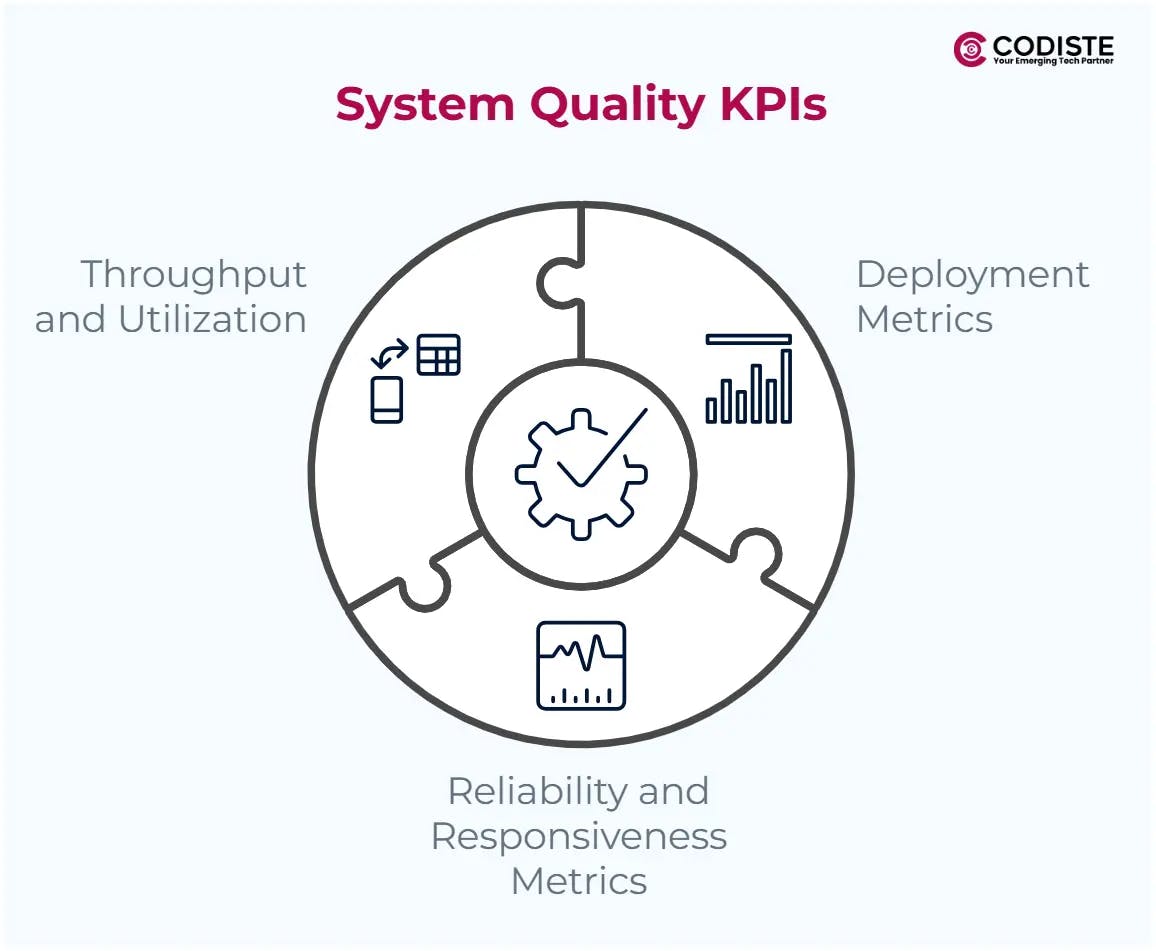
As we've written before, you'll need to invest in an end-to-end AI platform to harness the full potential of gen AI and enable your organization. These platforms must seamlessly integrate all the key components required to develop, fine-tune, deploy, and manage models at AI performance and scale while measuring the performance of various aspects of an AI system, including deployments, responsiveness, and resource utilization.
System metrics focus on the operational aspects of your AI system, ensuring it runs efficiently, reliably, and at scale to support the needs across your organization. They offer insights into the health, performance, and impact of your AI platform and infrastructure.
Tracking how many pipelines and model artifacts are deployed provides insights into your AI platform's capacity, governance, and organization-wide impact. Selecting appropriate metrics for the success of your AI project is crucial, as it helps align project objectives with business goals. Here are some of the most commonly used metrics:
Tracking how quickly your AI platform responds to requests is critical for user experience and maintaining model accuracy and application performance. Here are some of the most commonly used metrics:
Tracking throughput and resource utilization can reveal the processing capacity of your system. These metrics can help you optimize performance, manage costs, and allocate resources more effectively. Here are some of the most commonly used performance metrics below:
When to use them
The metrics you choose will depend on your AI platform and the type of gen AI model you choose. For example, using proprietary models like Gemini means critical metrics, such as required serving nodes, target latency, and accelerator utilization, are handled by a Google-managed service so you can focus on building your application via simple APIs. If using open models and hosting it yourself, you may need to incorporate a broader range of system quality metrics to help identify bottlenecks and optimize your AI system's performance.
Our custom AI development solutions can transform your business.
Operational metrics track how AI performance metrics can impact business processes and outcomes, varying by solution and industry. Developing frameworks for measuring AI success is crucial, as it involves addressing complexities such as data management, establishing specific KPIs, and incorporating both objective metrics and subjective evaluations. Changes in AI systems may affect KPIs differently; for instance, a retailer's chatbot might boost cart size but increase time-to-cart. Context and industry expertise are crucial for interpreting such shifts.
Here are some examples of AI implementation of business operational metrics used to track impact across the business strategies and most common gen AI use cases in different industries.
Enterprises are leveraging generative AI and AI agent implementation to transform customer service, driving personalization and productivity improvements across telecommunications, travel, financial services, and healthcare sectors. Key metrics such as call and chat containment rates, average handle time, customer satisfaction, and churn provide insights into AI’s impact on efficiency, retention, and morale. By aligning these indicators, businesses can enhance customer experiences, optimize agent performance, and achieve a seamless, cost-effective service transformation.
Generative AI transforms customer discovery through personalized recommendations and intuitive search experiences, particularly in the retail, QSR, and travel industries. Key metrics to track for AI agent success include Click-through rate (CTR), which evaluates the relevance of search results and recommendations. At the same time, time on site (TOS) reflects user engagement and satisfaction—longer TOS indicates deeper engagement, and shorter TOS on product pages indicates efficient discovery. Revenue per visit (RPV) gauges monetization effectiveness influenced by metrics like CTR, conversion rates, and cart size. Additionally, visit volume reveals meaningful insights into customer satisfaction, business growth, and the success of marketing campaigns.
Businesses can fine-tune their AI strategies by analyzing these metrics to enhance user engagement, drive efficient discovery data acquisition, and boost overall revenue, ensuring a seamless and impactful customer experience.
The broad potential of gen AI has introduced the need for a new set of adoption metrics to track its adoption and use across organizations, emphasizing the importance of measuring AI success. Unlike predictive analytics and AI technologies, which are often integrated directly into an application, Measuring AI success hinges heavily on changes in human behaviour and acceptance. For example, AI agents in business are only effective if your customers engage with them. Similarly, AI-enabled employee productivity tools can only drive productivity gains if employees adopt them into their daily workflows.
Here are some of the most commonly used metrics:
Adoption metrics reveal the usage and impact of your generative AI application, showcasing its value and areas for improvement. Combine quantitative data with qualitative feedback and collected data, like surveys or focus groups, for a holistic view of accessibility, reliability, and usability of AI capabilities, ensuring greater effectiveness in daily operations.
Proving the value of generative AI investments is a significant challenge for executives and business leaders. There is an increasing need to understand the impact of AI agents' ROI, which needs to be quantified. Business value metrics enhance operational and adoption metrics from existing systems, translating them into financial metrics that reflect the overall effect of AI initiatives on the organization.
The most common examples might include:
How do you apply them?
After establishing a solid plan for understanding business operations and adopting KPIs, your finance team can translate these into financial impact metrics. Evaluating the costs of building and maintaining generative AI is essential to understand your ROI fully. Consider cost drivers such as data size, usage volume, number of models, and necessary resources for development and maintenance. Since generative AI costs can vary significantly, choose models that align with your performance, latency, and budget requirements.
KPIs are the key to a successful foundation for AI agents, offering measurable insights into their performance, adoption, and overall value to the business. As illustrated in real-world use cases, KPIs provide a structured framework to evaluate success.
Metrics like call and chat containment rates, average handle time, customer satisfaction, and churn rates enable organizations to assess how well the AI agent resolves inquiries, improves productivity, and enhances customer experiences. Businesses can identify bottlenecks, refine workflows, and optimize resource allocation by monitoring human and AI performance.
Moreover, KPIs bridge the gap between technical performance and business impact by tracking system reliability, operational efficiency, and ROI.
A comprehensive understanding of specific KPIs allows businesses to make data-driven decisions, ensuring AI solutions align with organizational goals and deliver maximum value.
Ultimately, businesses need to track the right KPIs and empower their enterprises to unlock the full potential of generative AI. We at Codiste can help drive agentic AI success and customer satisfaction. Reach out to us, and let us foster growth.


Share your project details with us, including its scope, deadlines, and any business hurdles you need help with.
Countries Served Globally
Technocrat Clients
Repeat Client Rate